Happy November! Our team just had a good meeting discussing the positive job market growth outlook for the Orlando area. This will translate to a continuation of our solid housing market. October is seasonally a slow month. This year it’s compounded by the post-IRMA effect, which usually follows sensational hurricanes that cause home buyers to hesitate for a while. But the market always rebounds, especially if the northeast experiences a harsh winter.
I want to share with you this interesting new article by the Florida Association of Realtors. According to LendingTree migration study, Florida is still one of the top destinations for out-of-state home buyers.
Don’t forget this weekend is the daylight savings time change. We will send you a separate reminder this Friday!
LendingTree migration study: More homebuyers heading south
CHARLOTTE, N.C. – Oct. 31, 2017 – LendingTree, an online loan marketplace, released the findings of its study on where residents in each state want to move. In the latest study, LendingTree says it discovered a southern tilt in preferences for those people looking outside their own state.
Florida was the No. 1 new destination for 18 of the 50 states. Of all purchase mortgage requests during the study’s time period, 9.14% were for consumers looking to move to Florida. The Sunshine State has a history of bringing in visitors and new residents, particularly retirees.
The results reveal the most popular new destination for each state along with the percentage of out-of-state requests for that location.
States that love Fla. – % looking out-of-state– % of those looking at Fla.
Texas had the highest percentage of residents looking to move within the state versus outside of the state. 92.54% of purchase mortgage requests from individuals in Texas were for properties within the state. The second location with the highest percentage of residents looking to move within the state was Michigan.
In contrast to Texas, Vermont had the lowest percentage of residents looking to stay in state. 75.93% of requests in Vermont were for properties within the state.
If individuals are looking to move outside of state, most don’t want to go far.
More than half of the most popular new destination states border the current state. Of the states that the residents’ most popular new location does not border their current state, 16 were Florida.
However, in a related but separate Moving Popularity Score Index, South Carolina edged out Florida, even if more people actually seem to be looking at the Sunshine State. In South Carolina, mortgage loan requests from out-of-state movers were 56 percent greater than suggested by its share of the national population.
Florida ranked second, however, followed by Delaware, North Carolina and Georgia, revealing a southern tilt in the preferences of out-of-state home buyers.
At the other end of the spectrum, home buyers were least attracted to South Dakota, which received just 71 percent of the loan requests its population would suggest. California, Minnesota, North Dakota and Hawaii complete the bottom five.
The popularity score for each state was created by dividing the percentage of all out-of-state mortgage requests for the state by the percentage total population each state represents. A score of 100 means a state receives loan requests proportional to its population, above 100 means a state is more popular than its share of the national population and below 100 means a state is less popular than its share of the national population.
Moving popularity score: Top 10
Moving popularity score: Bottom 10
© 2017 Florida Realtors
As always, please feel free to contact us if you have any real estate questions or needs. We are ready and happy to assist.
Until next month, take care!
In light of recent natural disasters and the tragedy in Las Vegas, we are sending somber October greetings and hope your loved ones are well wherever they are. We are now entering the last quarter of 2017. We hope you have had a productive 2017 so far. It’s been another busy year in real estate but we are seeing the seasonal slowdown. Are you planning to buy or sell a home at the end of 2017 or in 2018? We have some early tips for you!
For Sellers:
We will stop here. Please feel free to reach out to us if you have more questions.
Until next time, please take care!
– Yien and The Yao Team
Happy September! Happy Labor Day! We hope you enjoy the long weekend ahead and have some well-deserved relaxation. In the real estate world, we are now past the peak buying and selling season. September and October are when we regroup and prepare for the end of the year market.
Each season is unique, and comes with its own challenges and opportunities. After August, the buyer demographic changes to fewer families with school-age children (they’ve already bought). Often at this time, buyers emerge that enjoy less competition from other buyers. Investors buy all-year round so that does not change. Some sellers also appear at this time. You may ask, what possible advantage could be had by putting a home on the market past peak season? One is that we have more clear market intelligence. Homes continue to sell even in the slow season. The potential advantage, I advise sellers, is that we can study the market comps from the peak season and see what has been achieved. Within the most recent 6-months, the highest sales in the neighborhood is a good indication of the price ceiling in the slower season. For example, if no similar home has achieved a certain price point during the peak season, it is unlikely for that price point to be achieved in the slower season. This can help sellers make the most informed decisions.
2017 has been an interesting year. As the market reaches maturity, we see different forces push and pull to shape the sales. Some feel the prices may continue to increase, others fear a correction may be coming. We have listed homes from investors who are taking profit and exiting the market this year, and see the buyers of those properties being other investors looking to enter the market. Each person’s perspective, reasons, and needs are unique. Share your real estate goals with us, and we are happy to brainstorm with you on potential options.
Please continue to send your real estate questions to us. We will answer each personally.
If you need to buy or sell a home, definitely reach out to us. We have so much to share with you. We are bombarded with market information every day. As a team, we digest these information together and discuss how we may use these information for the benefit of our customers. We are honored when you entrust your real estate needs to us and we do not take that privilege lightly.
Happy August! In the blink of an eye, the summer break is almost over. Kids are getting ready to go back to school. Usually with the coming of August, our local real estate market activity begins to cool a bit. This is seasonal and expected. Most sellers and buyers complete their relocation during the summer time. It has been a busy summer. Our team helped many families and individuals buy, sell, upsize, downsize, or simply relocate to a different part of town.
“How is the market doing?” is the most common question. The market is healthy and stable, in that it is showing some signs of reaching a plateau. I will share some observations in our brokerage.
With these said, please understand our market remains healthy. We are not in a real estate bubble. A market stable in value is healthy. We simply have to get over the bad habit of expecting double digit value increases. Many of the contributing factors of the 2004-2006 bubble have been corrected. For example, the mortgage industry is more accountable for the loans they originate. Mortgage loans are made to buyers that can really afford the payments. The appraisal process is independent and not subject to artificial inflation of value that cause price swings. These contribute to our current strong foundation in real estate ownership and value.
We believe in the value of real estate ownership both professionally and personally. We are active participants of this market in the buying and selling of or own properties. We hope you will count on us as advisors when it’s the right time for you to buy or sell a home.
Happy month of July! This is the start of the third quarter and we are officially in the summer season now. We hope you and your family are finding ways to enjoy this hot weather in central Florida. The real estate market has been equally hot in the last quarter. We have all been very busy servicing home sellers and buyers. Orlando Board of Realtors sold 3,817 homes in May, which is 14% more than the 3,347 sales in May 2016. Orlando’s overall median home price now is $218,000, which is 7.5% above the same month 2016 median price of $203,000. The overall average home price is $258,322, an increase of 6% over that of May 2016.
Now let’s look at some fun housing stats from June in the Orlando area, encompassing Orange and Seminole County.
In the last 30 days, 354 CONDO units have sold with an average sale price of $131,569.


The lowest-priced sale was a 1 bedroom, 1 bath, 762 square foot condo in 32839 zip code, selling for $20,000 (on left). 3964 Crayrich Circle, #301, Orlando
The highest-priced sale was a 4 bedroom, 4-bath, 4,090 square foot condo in Winter Park, selling for $1,275,000 (on right). 300 S Interlachen Avenue, #304, Winter Park
In the TOWNHOUSE category, 249 units have sold, with an average sale price of $221,731.


The lowest-priced sale was a 1 bedroom, 1-bath, 420 square foot unit in Winter Garden, selling for $62,000 (on left). 416 Eron Way, #30, Winter Garden
The highest-priced townhome sale was a 3 bedroom, 3-baths, 2,434 square foot unit in Winter Park, selling for $715,000 (on right). 1142 S Pennsylvania Avenue, Winter Park
In the SINGLE FAMILY HOME category, 2,104 homes have sold with an average sale price of $328,506.

Of these homes, the lowest-priced sale was a 2 bedroom, 1-bath, 700 square foot home in 32810 zip code area, selling for $20,000 (on left). 3500 Doctor Love, Orlando
On the other end of this scale, is a 5 bedroom, 5 full-bath, 2 half-bath, 6,535 square foot custom home in 32836 zip code area, selling for $3,400,000 (on right). 9720 Vista Falls Drive, Golden Oak
Are you looking to buy or sell a home? Give us a call. We have 40 years of combined experience in Central Florida. We are truly your Orlando area experts and advocates.
Until next quarter, take care! Remember we are always just a phone call or email away.
Yien and the Yao Team.
Happy month of June! The Orlando job market, real estate market, and weather are HOT!
We noticed there are a lot of relocation homebuyers this year. This continues the trend of the recent years. It’s not a surprise when we learned that Orlando is one of the nation’s fastest growing labor markets. Orlando is adding more than 3,500 new jobs per month! This bodes well for a strong local economy, and extends the strength into our housing market.
The demand for housing remains strong. The current average Orlando home sale price is $252,700, and median price is $215,000. With all the activities, the market is still a balanced one. By that I mean the price is actually stable and not escalating. Buyer and Seller appear to be on similar footing in terms of leverage. What we experience daily in the “trenches” is more negotiation and more problem-solving in each transaction. Unofficially but from experience, all these suggest a mature market.
Weather-wise, the heat is raising and the rain is coming. We hope our local drought condition will be ameliorated. The recent fire in Chuluota reminds us of the bigger environmental picture that affects us all.
Starting with June, we officially enter the 2017 Atlantic hurricane season. It lasts through the end of November. We have had a nice long run of 11 years without a hurricane making landfall. (Until Hurricane Hermine hit the Panhandle last September and Hurricane Matthew swept along the east coast in October).
It’s easy to get complacent in central Florida because hurricane crossing is a rarity. But the memory of the 3 hurricanes that hit Orlando in 2004 is still vivid for some of us. Even now, many homes that we list still have plywood boards left in the garage for covering windows and doors during a storm. It’s always a good idea to heed the motto “be prepared”. National Oceanic and Atmospheric Administration predicts “above average” hurricane activities this year.
It’s a good idea to make sure you have a supply of nonperishable food and water to last 3-7 days, as well as supply to deal with loss of power for the same duration. The Florida Legislature approved a 3-day “disaster preparedness” sales tax holiday June 2 through June 4, to encourage the public to be proactive in preparedness
As homeowners, you should also check and make sure your property insurance is adequate. Understand the difference between the regular deductible, and the separate deductible for hurricane damages, which are generally based on a percentage of the home’s insured value rather than a flat dollar amount. For example, you can have a $1,000 deductible for regular damage claims, but a separate 2% deductible for hurricane damages. If your home is insured for $350,000, then 2% of that is $7,000. That means if a storm causes damages, you will be responsible for the first $7,000 of repairs!
The hurricane deductible usually goes into effect only when a storm is categorized as a hurricane by the National Weather Service. In some policies, it kicks in when a storm is named, even if it doesn’t become a hurricane.
Is your property insurance adequate? The Florida Department of Financial Services offers a hurricane financial prep toolkit in PDF form. It has an insurance checklist that includes adjuster contacts and emergency service contacts, such as the Red Cross, FEMA and the Department’s consumer helpline, as well as a log of calls made to insurance companies about claims.
You can download a copy here.
Once prepared, I hope we do not see a hurricane making landfall this year!
As always, if you are planning on buying or selling a home in 2017 or even 2018, it’s never too early to have a conversation with us. Many of our clients today started planning with us last year!
Give us a call if you have questions, or know of someone we can help!
Until next month, take care!
Yien and the Yao Team.
Happy month of May! We are currently in the early phase of the peak real estate buying/selling season in Orlando. The activity came on strong, and a little earlier this year! One reason may be buyers are motivated by the fear of rising mortgage interest rates. They want to take advantage of the relatively low current interest rates. It is now north of 4% for an average 30 year mortgage, but it is expected to rise over the rest of the year.
Federal Reserve officials’ decisions on interest rates indirectly affect fixed-rate mortgages. They raised interest rates at the March meeting to a range between 0.75 percent and 1 percent, and they penciled in two more quarter-percentage point increases this year. What will actually happen depends on ongoing economic growth indicators.
How interest rate affects the real estate market, is how it affects the purchasing power of buyers. A general rule of thumb is, for every 1% rise in mortgage interest rate, the same monthly payment support 10% less home loan. For example, last year when the rate was at 3.5%, a home buyer out looking at $500,000 homes, would only be able to afford a $450,000 home when the rate hits 4.5%.
This is significant for both home buyers and sellers. It is easy to understand for home buyers because they can afford less of a home when the rates rise. But for the sellers it’s also significant because there are fewer buyers able to afford their homes given any price range.
Low interest rates have been credited as a major driving force behind the strength of the real estate market since the Recession. I hope the strength of our economy now can continue to support the health of our housing market, gradually shifting over from the low interest rate.
So, while the buyers are out in droves shopping for homes, Home sellers are taking advantage of this wave. Many of our home seller clients have been positioned early to catch this early wave of home buyers, others are coming online over the next 3 months. Most of our listings are under contract now, the rest will be by mid-summer.
If you are planning on buying or selling a home in 2017 or 2018, it’s never too early to have a conversation with us. Many of our clients today started planning with us last year.
Give us a call if you have questions, or know of someone we can help!
Until next month, take care!
Yien and the Yao Team.
Happy April! This year, spring started on March 20. I wish you a wonderful spring season. Whatever personals goals you have for 2017, I hope you are well on your way to accomplish them.
I want to share a Central Florida market snapshot with you.
This is a quick look at the sales and active listings in our MLS.
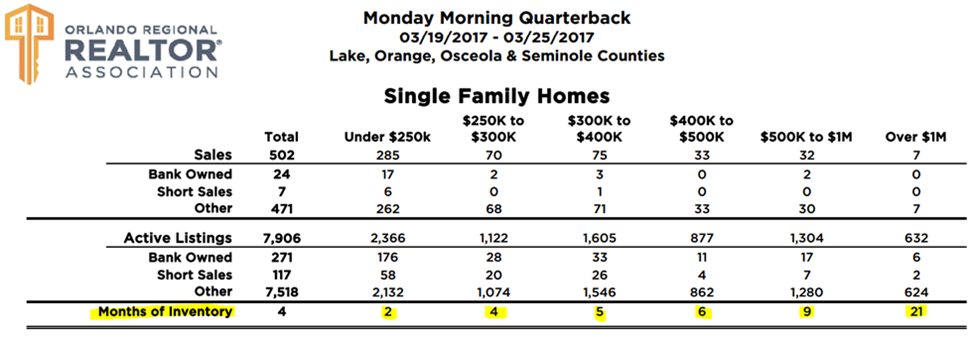
The listing composition of our residential real estate market is:
So, we have a healthy balance of 95% traditional offerings, and 5% (foreclosure + short sales) distressed listings. This is a far cry from the years when our market was 75% distressed sales.
You have heard me describe the “tale of three markets” in Orlando. That is, for homes under $300,000, we are in a seller’s market, where the seller has advantage and leverage over the buyers. At the price range between $300,000 and $500,000, we are in a balanced market, where neither seller nor buyer has undue advantage over the other. Above $500,000, we are actually in a buyer’s market, where the buyer has advantage and leverage over the seller.
This table also illustrates this effect. Please take a look at the highlighted portion at the bottom of the table. Months-of-inventory means the number of months it would take to sell all the existing active listings. This indicates the supply-and-demand dynamic. The long-term average of a balanced market is between 5-6 months of inventory.
If you are looking to buy or sell a home in 2017, let us brainstorm with you to come up with the best strategy.
If you are looking to buy a home below $300,000, we will do everything we can to improve your odds in the challenging seller’s market.
If you are upsizing and buying a higher priced home, you may be selling your current home in a seller’s market, but buying the next one in a buyer’s market. This may turn out to be an ideal situation.
If you are downsizing, you may be selling in a buyer’s market, but will be buying in a more competitive seller’s market.
In all the situations, you can benefit from our experience and expertise. We are not sales-people. We are consultants. We take pride in using our know-how to maximize your outcome. We appreciate the opportunity and your continuing trust.
Give us a call if you have questions, or know of someone we can help!
Until next month, take care!
Yien and the Yao Team.
Happy March! I sincerely hope 2017 is going fantastically for you.
I just returned from the Keller Williams annual national conference. I want to share with you some information that put into context some market phenomenon I’ve observed in Orlando. This is of personal interest to me, I hope you might find it enlightening as well.
Please keep in mind, the graphs below are based on NATIONAL averages. This is a national overview while real estate is hyper-local. If you want to know about your specific situation, just reach out to me and I’ll provide a custom assessment for you.

The graph above is based on U.S. national averages. The data for individual cities are not available but from my experience, Orlando follows this trend except our median price is lower overall (for example, Orlando median home price was $200k in 2016).
The YELLOW line indicates historic median home price appreciation. Since 1989 the average annual increase is 4%. During the real estate bubble from 2002-2007 you can see the median price went way above the trend line. After the peak in 2016, the market began a correction. You can see the median price corrected back to the trend line in 2008. This proved too much for the economy, the market collapsed and over-corrected over the next several years to a bottom in 2011. These were the years we worked with many investors.
Now, we are seeing a return back to the annual 4% trend line (the new BLUE line). We do not see the market going back to the original yellow line. The belief is that the trend line has been reset and the blue line is the new trend we should follow. The difference between the yellow line and the blue line, is a 16% market gap caused by the lost years through the real estate bubble.

Now, another phenomenon we are experiencing in the current market is low inventory. One of the contributing factors is shown in the chart above. Historically, one million new homes are built each year to meet the demands of our growing population. The real estate market collapse and subsequent foreclosure crisis took out the new home builders after 2007. Many builders went out of business. So again, you can see during these “lost years” there was an accumulated low supply to the stock of new home inventory.
This new home stock continued to grow but still has not fully recovered. In 2016, at 781,000 new single-family homes, it is still significantly below the historical annual level of 1,082,000 newly constructed homes.

The graph above demonstrates an additional factor which explains what I have written about many times in the past. That is, we see 2 markets in Orlando. At lower price points the demand far exceeds the supply, but at higher price points the market is either balanced or over-supplied.
With the new home builders returning to the market, they did not return to all price segments equally. Majority of the new homes constructed were in the $250k-$400k range (see the PURPLE line), followed by the luxury homes above $400k (Yellow line). The profit margin is higher in the higher price segments. Therefore many builders have avoided the below-$250k market (GREEN line). This lack of construction in the entry-level price range has contributed to the shortages, causing extremely low inventory levels of entry-level houses.
I can talk about this all day but I should stop here.
Please feel free to reach out to my team with all your real estate needs. We have the most recent local market information. We can help you navigate through all the bulk information on the internet and make the most informed decision for your unique situation.
Our business has always grown by referrals. We are honored to help your family and friends. We will take care of them as our own.
Until next month, take care!
Yien and the Yao Team.
This month, I will explain the Florida Homestead Exemption, since the application deadline is fast approaching on March 1, 2017.
If you moved to a new home last year and haven’t done so already, please remember to apply for the Florida Homestead property tax exemption before the deadline of March 1, 2017. There are numerous financial benefits to having this exemption, including a saving of up to $750 annually on property taxes!
Florida residents who own and live in their permanent residence can apply for this exemption. You must live in the home as of January 1st of this year.
Another major benefit of the Homestead Exemption is that the assessed value of your home, which is used to calculate your property taxes, cannot increase more than 3% per year, pursuant to the Save Our Homes Amendment to the Florida Constitution. This prevents large increases in property taxes with market fluctuation that can be devastating for homeowners on a fixed-income.
After a homeowner has lived in a home for many years, the assessed value “savings” can accumulate to a significant amount. In the past, this accumulated savings used to be lost when a homeowner sold their home and moved to a new one. This resulted in some homeowners effectively become “trapped” and couldn’t afford to move because the new home had a much heavier tax burden. Fortunately, Florida passed the law that allowed “Portability”, where we can now transfer up to $500,000 of accumulated “savings” from a previous homestead to a new one. The diagram below explains this.

You should definitely take advantage of this law. Be sure to apply if you haven’t done so already.
Once you receive the Homestead Exemption, it is automatically renewed each year. You do not have to re-file again, until you move.
You can file the application online, by mail, or in person. We have included links for the 5 counties in Central Florida at the bottom for your convenience.
You will need to provide the following documentations:
Orange County
Main homestead page http://www.ocpafl.org/Exemptions/hx_file.aspx
Online Form https://exemption.ocpafl.org/
Satellite offices http://www.ocpafl.org/satelliteoffices.aspx
Seminole County
https://hx.scpafl.org/HxPreQual.aspx
Osceola County
https://ira.property-appraiser.org/homestead/WebForm1.aspx
Lake County
https://www.lakecopropappr.com/exemptions.aspx#homestead
Polk County
Okay I will stop here. We sincerely wish you a happy, healthy, and prosperous new year. As always, if you have any real estate related questions, give us a call! We are happy to discuss real estate topics even when it’s not business.
Also, we love referrals!
Until next month, take care!